SMART and disk health
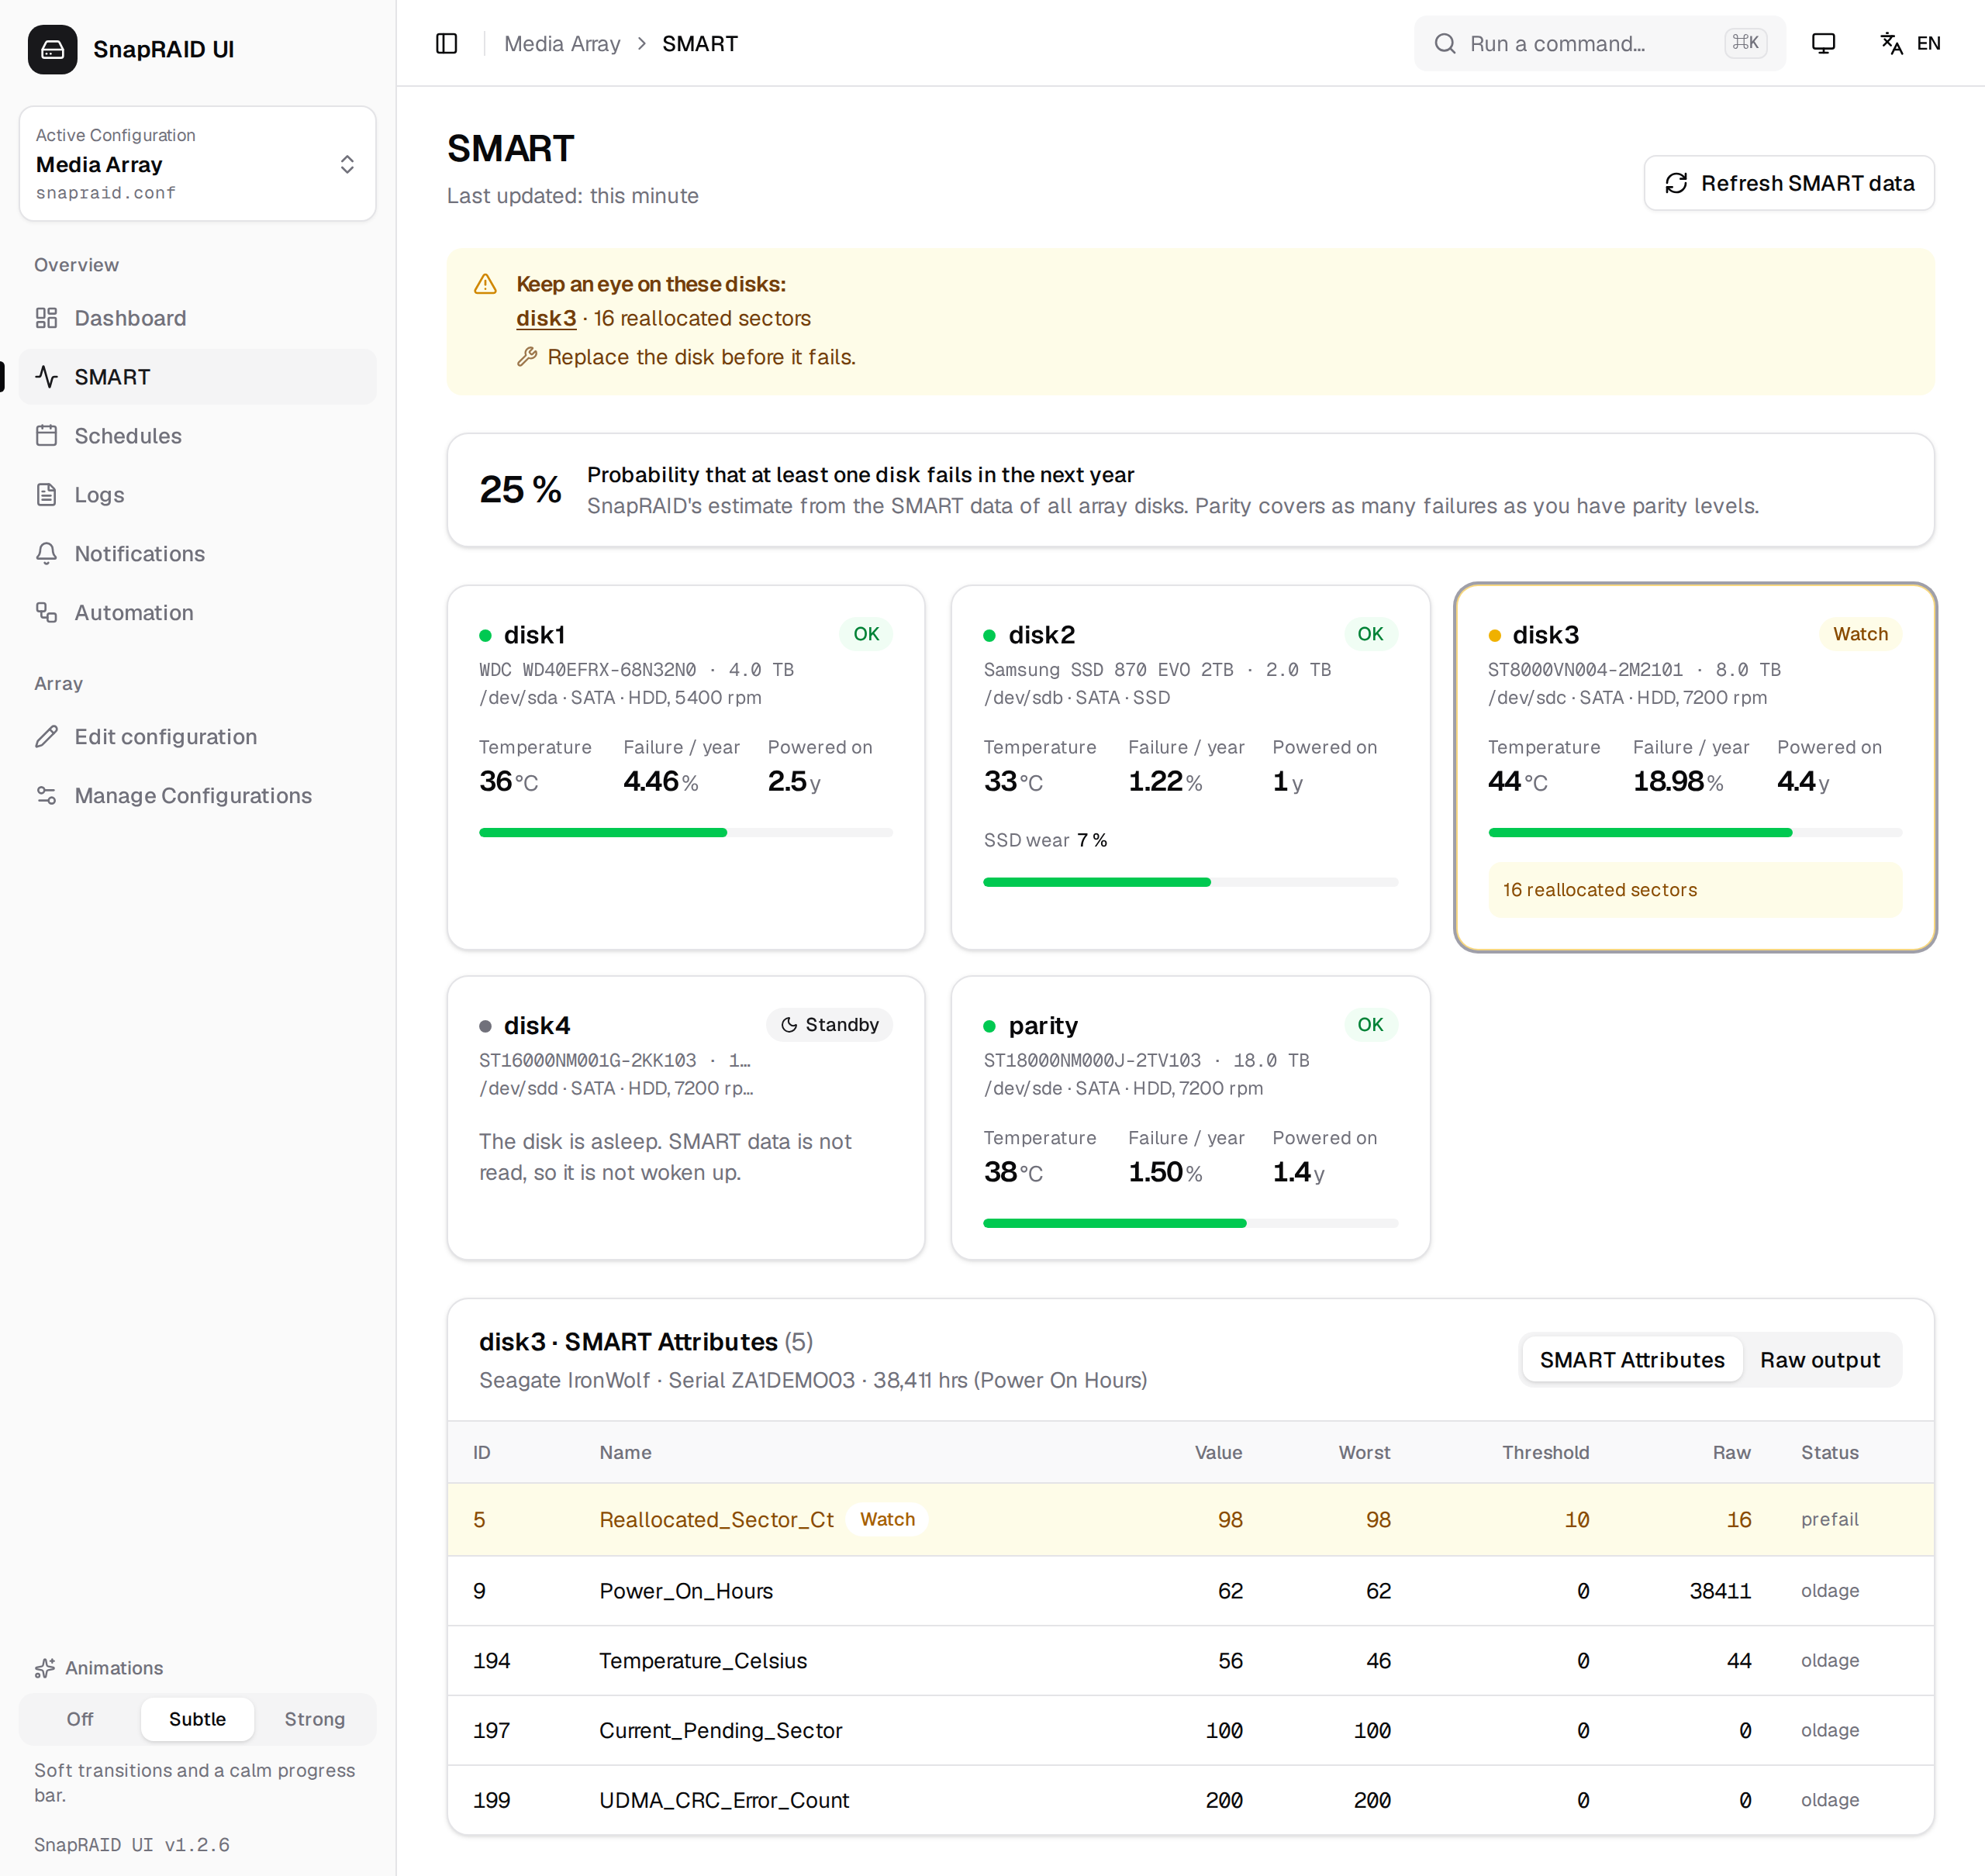
The SMART page shows the health of every disk in your array: temperature, failure probability, error counters and SSD wear, with a plain-language verdict and advice on what to do. This page also covers the usage history and the fill-up forecast on the dashboard.
Requirements
SnapRAID UI reads SMART data with snapraid smart, which calls smartctl (smartmontools ships with the Docker image). Inside Docker, the container needs --privileged to access the disks, see Installation. Some USB enclosures don't pass SMART data through.
If no disk reports SMART data, the page shows SnapRAID found no disks with SMART data. Inside Docker, SMART needs the container to run with --privileged.
Reading the page
Pick the configuration in the config bar. The data is read when you open the page and kept for five minutes. Refresh SMART data reads it again; Last updated in the header shows when it was read. Reading takes a few seconds.
At the top you see the overall verdict:
- All N disks look healthy when no disk has a problem,
- Replace these disks soon, they show signs of failing: for disks rated Critical,
- Keep an eye on these disks: for disks rated Watch,
each listing the disks with their reasons, followed by advice. Click a disk name to jump to its details.
Below it, a card shows SnapRAID's Probability that at least one disk fails in the next year. It grows with the number of disks, so the per-disk threshold doesn't apply to it. Parity covers as many failures as you have parity levels.
Disk cards
Each disk has a card with:
- name, model and size, device, interface and type (SSD, or HDD, … rpm),
- a badge: the raw SMART status (e.g.
OK) while all is fine, Watch or Critical when something stands out, or Standby for a sleeping disk, - Temperature, Failure / year (SnapRAID's estimated yearly failure probability) and Powered on (in years, from attribute 9),
- SSD wear, Media errors and Error log entries when the disk reports them,
- a temperature bar, scaled to the critical 60 °C,
- the list of reasons when the disk is rated Watch or Critical.
Click a card to show its details below the cards. Until you pick one, the details show the disk that needs attention most.
Details
The details have up to three tabs:
- SMART Attributes: the attribute table (ID, Name, Value, Worst, Threshold, Raw, Status). Attributes that are or were below their threshold, and counters that matter (see below) with a raw value above 0, are highlighted and marked Watch or Critical.
- History (N days): charts of the daily values, see History.
- Raw output: SnapRAID's text output of the smart command.
The heading also shows the model family, serial number and power-on hours.
Warnings and what to do
A disk is rated by these rules. The worst finding sets the level of the disk.
| Finding | Watch | Critical | Advice |
|---|---|---|---|
SMART status FAIL: the disk reports itself as failing |
✓ | Replace | |
SMART status PREFAIL: a pre-failure value is below its limit now |
✓ | Replace | |
SMART status LOGFAIL: a pre-failure value was below its limit in the past |
✓ | Replace | |
SMART status LOGERR: entries in the disk's error log, often a loose cable or a past power cut |
✓ | Cable | |
SMART status SELFERR: a SMART self-test failed |
✓ | Replace | |
| Reallocated (5), pending (197) or uncorrectable (198) sectors above 0 | ✓ | Replace | |
| Uncorrectable read errors (187) above 0 | ✓ | Replace | |
| Transfer errors (CRC, 199) above 0 and growing | ✓ | Cable | |
| Media errors (e.g. NVMe "Media and Data Integrity Errors") above 0 | ✓ | Replace | |
| SSD wear | 80 % or more | 100 % or more | Replace |
| Failure probability per year | from the threshold (default 25 %) | 50 % or more | Replace |
| Temperature | above 50 °C | 60 °C or more | Cooling |
| SMART data could not be read (and the disk is not asleep) | ✓ | Access |
The numbers in brackets are SMART attribute IDs.
The advice shown below the warnings:
| Advice | Text |
|---|---|
| Replace | Replace the disk before it fails. |
| Cable | Transfer errors and error log entries usually come from the cable or the backplane. Replace it if the count keeps growing; a count that stays the same is harmless. |
| Cooling | Improve the cooling, heat shortens the life of a disk. |
| Access | Check that the disk is connected. Inside Docker, SMART needs the container to run with --privileged; some USB enclosures do not pass SMART through. |
If a disk needs replacing, the replacement wizard guides you through it.
Failure probability
The failure probability is SnapRAID's estimate, computed from the SMART data. SnapRAID's model gives healthy disks a few percent per year, so the default threshold of 25 % warns well above that. You change the threshold under Notifications (Warn from a yearly failure probability of). It applies to both the SMART page and the notifications, so they always agree. 50 % or more is always critical.
Transfer errors (CRC)
CRC errors (attribute 199) are transfer errors between disk and controller, usually caused by a cable or backplane, not by the disk itself. The counter never goes down, so an old cable problem would warn forever. SnapRAID UI therefore only warns while the count grows:
- The first non-zero count seen for a disk becomes its baseline and is treated as harmless.
- When the count grows, the disk is rated Watch. It stays a warning for 30 days after the last increase, so a single check doesn't hide it again.
- While the count stays the same, the card shows a note instead of a warning, e.g. 12 transfer errors (CRC), unchanged since 05/09/2026. An old cable problem, only a growing count is a warning.
- A smaller count (a reset counter or a different disk) becomes the new baseline.
The baseline is updated on every SMART read, from the page or a scheduled smart job, and stored in smart-baseline.json in the data directory. Disks are recognized by their serial number (by config and disk name if none is reported).
Error log entries
Error log entries are shown on the card but don't cause a warning on their own; they are harmless in most cases. The LOGERR status that SnapRAID derives from the error log does count as Watch.
Disks in standby
A sleeping disk is not woken up for SMART: smartctl leaves it alone. Its card shows Standby and The disk is asleep. SMART data is not read, so it is not woken up. A disk in standby:
- counts as fine, not as unreadable,
- adds no point to the history,
- keeps its CRC baseline unchanged.
The dashboard's disk table shows the power state of each disk as well (Active, Idle, Standby (spun down)).
History
Every SMART read stores one point per disk and day: temperature, reallocated sectors, pending sectors, transfer errors (CRC), media errors and SSD wear. A later read on the same day replaces that day's point. The history keeps the last 365 days per disk and is stored in smart-history.json in the data directory. Disks are recognized by their serial number when the disk reports one, so a disk keeps its history when it moves to another slot.
The History (N days) tab appears once a disk has at least two days of data. It shows one small chart per value: temperature always, the counters only once they count something. Disks in standby and unreadable disks add no points.
[!TIP] The history only grows when SMART is read. Create a daily
smartschedule (see Scheduling) to get a point every day and SMART notifications at the same time.
Usage history and fill-up forecast
The disk table on the dashboard (Disks) tracks how your array fills up.
Recording. Each time the dashboard reads the array status successfully, one point per configuration and day is stored: used and free space of the array and of each data disk. A later read on the same day replaces it. The last 730 days (two years) are kept in usage-history.json in the data directory.
[!NOTE] Points are recorded when the dashboard reads the status, not by scheduled or manual
statusruns. Opening the dashboard now and then is enough; days without a visit simply have no point.
Usage history. With at least two days of data, the disk table gets the tabs Table and History. History shows a chart of the protected data over time, titled Usage history (N days), with the trend, e.g. Free space shrinks by about 120 GB per month (last 90 days).
Fill-up forecast. For each data disk, the free space of the last 90 days is fitted with a linear trend. If the disk keeps filling at that rate and would be full within a year, its row shows a badge full in about N days (red within 60 days). The forecast needs data spanning at least 14 days, so a few copied files don't look like a trend. Disks whose free space is not shrinking get no badge.
The disk table also marks disks as Filling up from 85 % used and Almost full from 95 %. See Usage for the rest of the dashboard.