Logs
Every SnapRAID job, whether you started it on the dashboard or a schedule did, writes a log. The Logs page lists them, sums up each run and shows the full output.
What gets logged
A log is written for every job: sync, scrub, check, undelete (fix), touch and pool from the dashboard, the steps of the disk wizards, and every step a schedule runs (for example touch, sync and scrub of a nightly routine, or a scheduled SMART check). A scheduled run that is skipped (see Scheduling) leaves no log. The read-only commands that open a dialog (Status, Diff, File List, Duplicates, Devices) and the diff in the sync preview don't write a log.
The UI starts SnapRAID with -l <file>, so each log is SnapRAID's own structured log: one tag:value line per event, with the command line, the config, every message, error and the final summary. The UI reads it to work out the result and the figures shown on this page and on the dashboard; see Architecture for details.
Log files are named <command>-YYYYMMDD-HHMMSS.log with the start time in UTC, for example sync-20261005-031500.log, and are stored in the logs directory inside the data directory (see Configuration).
The log list
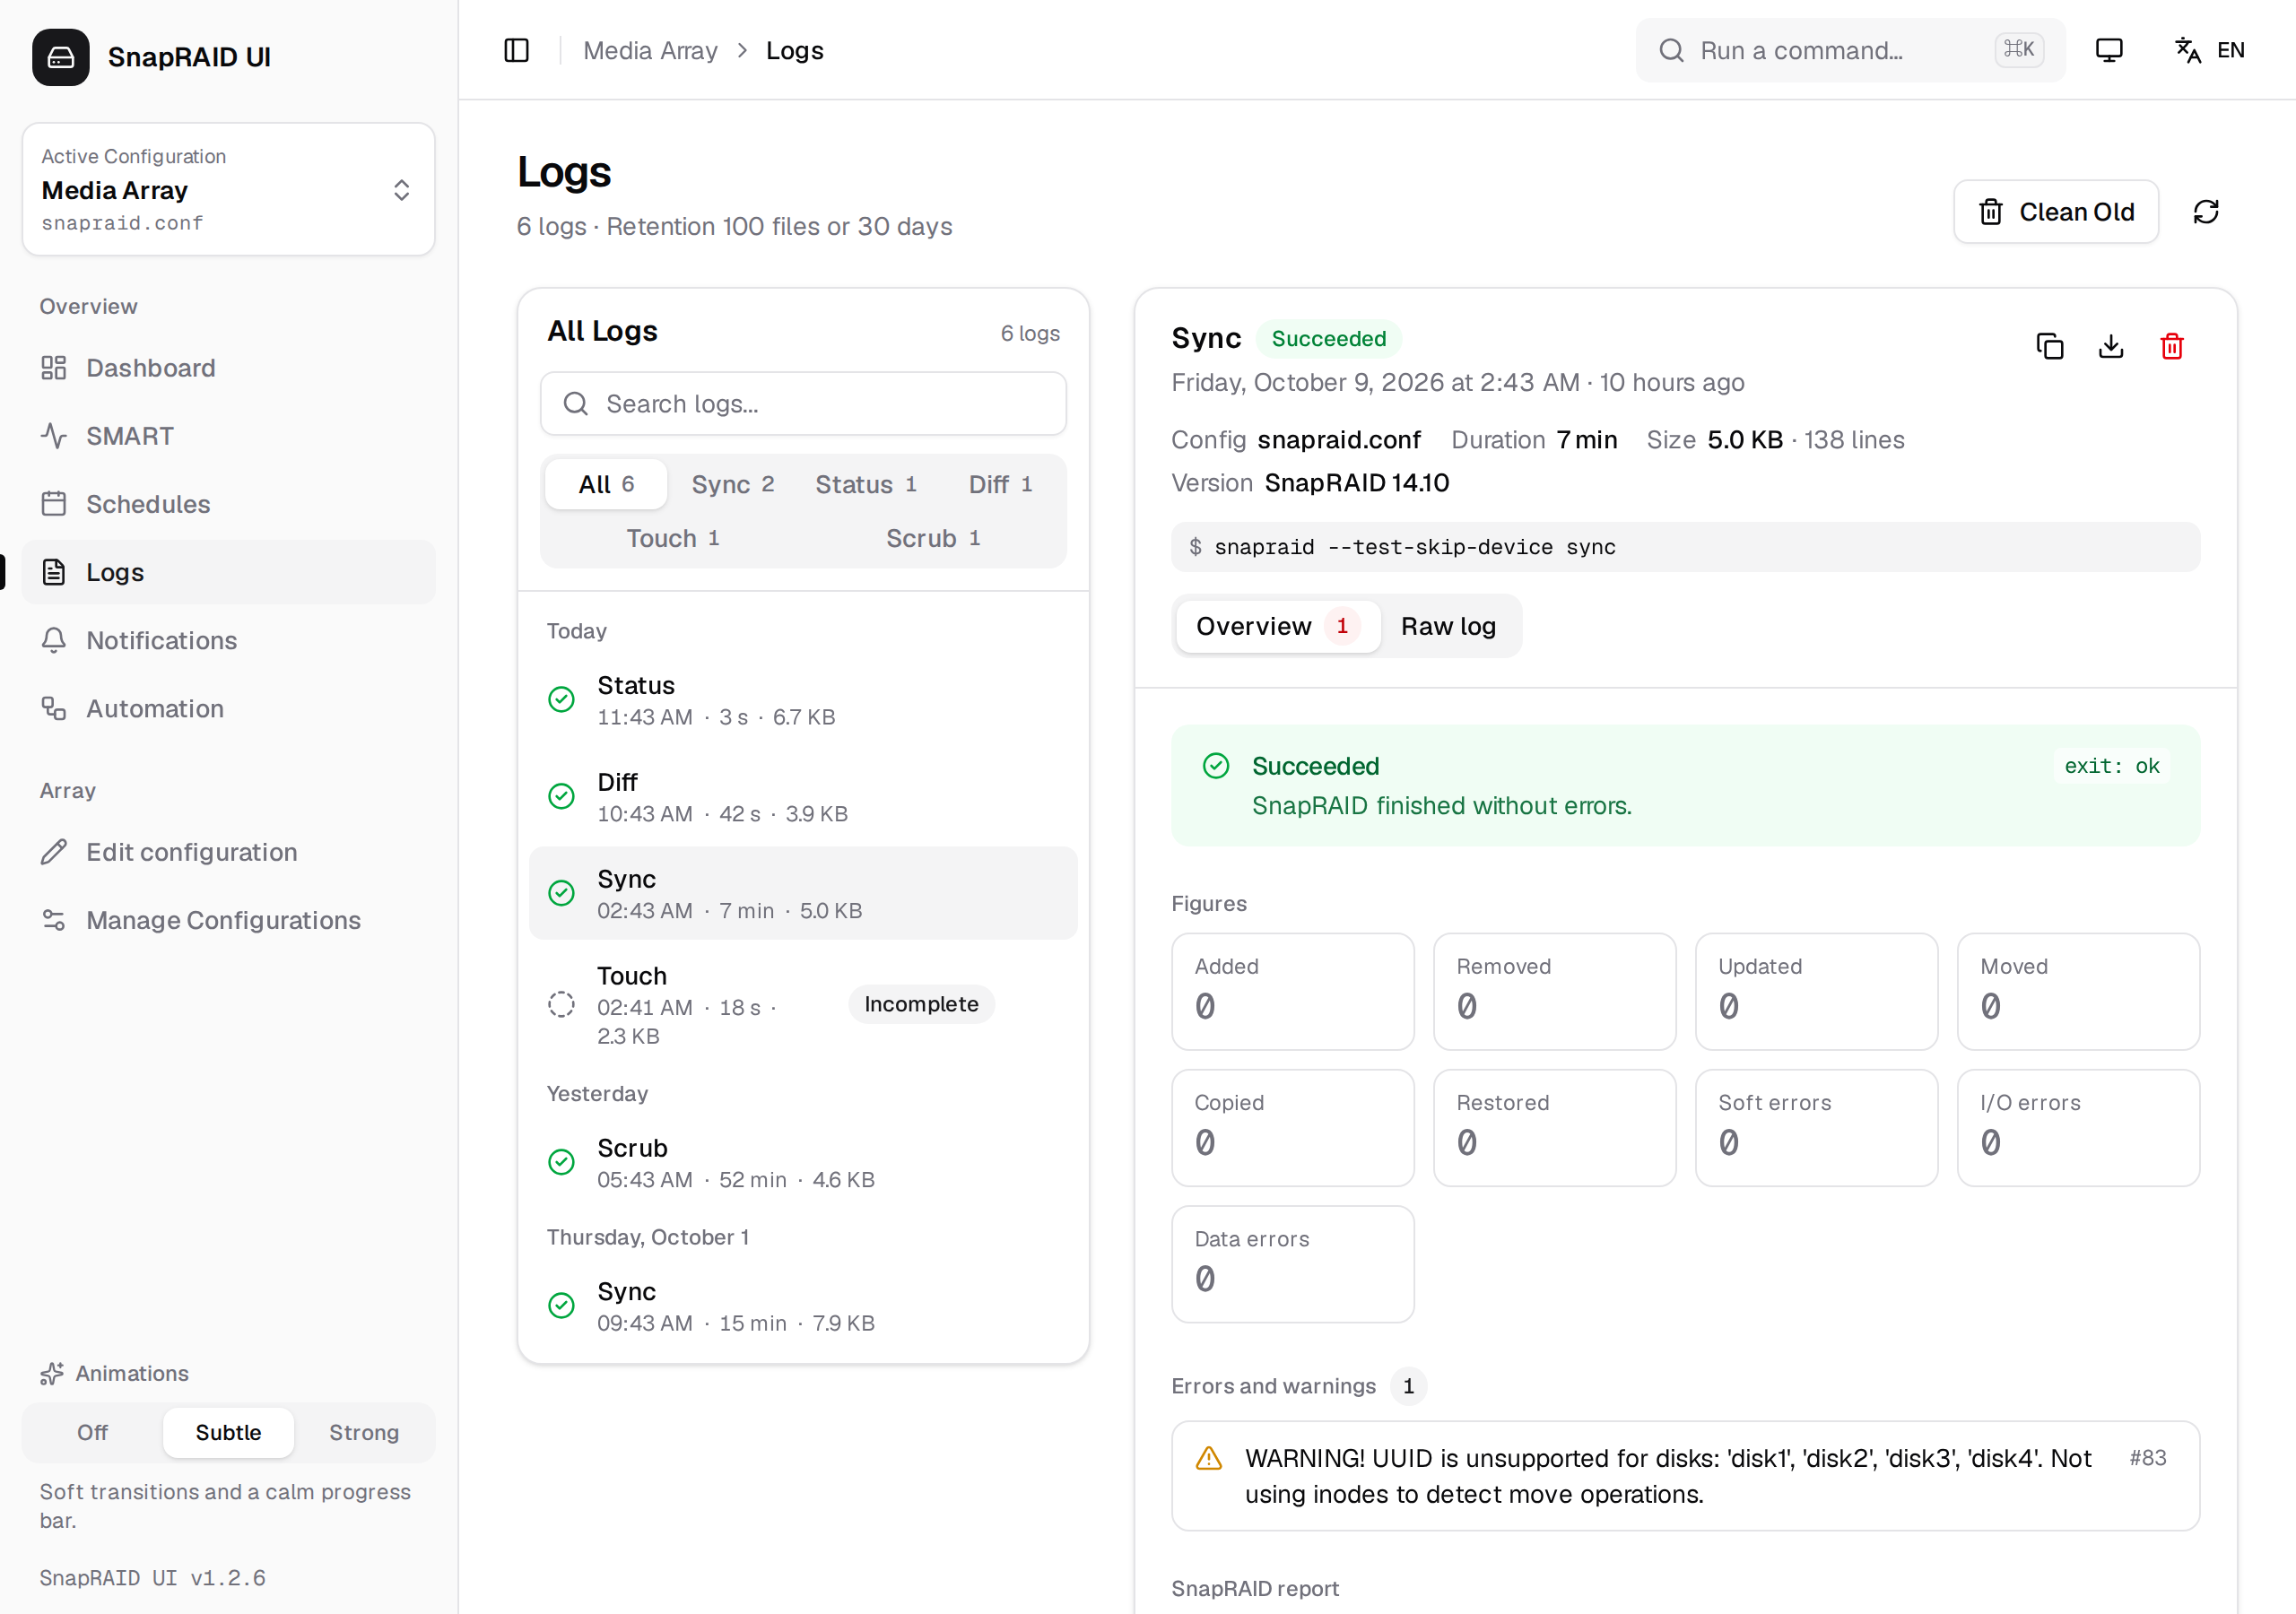
The list on the left shows the newest logs first, grouped by day. Each entry has:
- an icon for the result, or a spinner and a Live badge while the job is still running
- the command, start time, duration and file size
- the configuration name, but only if your logs come from more than one configuration
- a badge for results that need attention (With warnings, Failed, Aborted, Incomplete); successful runs get none
The header above the page shows how many logs there are and the configured retention, e.g. 100 logs · Retention 100 files or 30 days. The refresh button reloads the list; while a job is running, the list also refreshes itself every few seconds.
Filtering and searching
| Filter | What it does |
|---|---|
| Search logs... | Matches the file name, the command, the config path, the result and the date and time. It does not search the log contents; use the line filter in the raw log for that. |
| All and one button per command | Shows only logs of that command; each button shows its count. Click the active command again to show all. |
| Problems | Shows only runs With warnings, Failed or Aborted. Appears only when there are such runs, and combines with a command filter. |
If nothing matches, Reset filters clears search and filters at once.
Opening a log
Click an entry to open it. With the list focused, ↑ and ↓ step through the logs like in a mail client.
The selected log is part of the address (/logs?file=sync-20261005-031500.log), so you can bookmark or share the link, and it survives a reload. The Log links on the dashboard's Last sync and Last scrub cards open the matching log this way.
On narrow screens the list and the log take turns; Back to the list returns to the list.
Viewing a log
The top of the log shows the command, its result, the start time, and:
| Field | Content |
|---|---|
| Config | The SnapRAID configuration the run used |
| Duration | From start to the last write to the log |
| Size | File size and number of lines |
| Version | The SnapRAID version that wrote the log |
Below that is the command line SnapRAID was started with, without the -c and -l options the UI always adds, e.g. $ snapraid sync -h.
The buttons at the top right are Copy to clipboard, Download and Delete.
[!NOTE] Browsers allow copying to the clipboard only over HTTPS (or on
localhost). On plain HTTP, use Download instead.
While the job is still running, the log shows a Live badge and reloads every few seconds.
Overview
The Overview tab sums up the run. A number on the tab counts the errors and warnings found.
- Result with SnapRAID's exit status (e.g.
exit: ok) and a short explanation. - Figures: the totals from SnapRAID's summary, as far as the command reports them, for example Added, Removed, Updated, Moved, Copied, Restored, Files, Duplicates, Soft errors, I/O errors, Data errors and Unrecoverable. Error counts above zero are shown in red.
- Errors and warnings: every error, fatal error and warning SnapRAID printed. The line number (
#123) next to each one jumps to it in the raw log. - Affected files: files with block errors, most affected first, with the number of errors per file. The first 8 are listed, the rest are summed up.
- SnapRAID report: the human-readable report SnapRAID printed, such as the status table.
If none of that applies, the overview says SnapRAID did not report anything for this run.
Raw log
The Raw log tab shows every line of the log, colored by kind: errors and fatal errors in red, warnings in yellow, summary lines in cyan, and less important lines dimmed.
| Control | What it does |
|---|---|
| Filter lines... | Shows only lines containing the text and highlights it; the number of matches is shown |
| Less detail | Hides progress, memory and device lookup lines |
| Wrap | Wraps long lines instead of scrolling sideways |
Very long logs show the first 2,000 lines; Show all N lines renders the rest. A jump from the overview always reaches its line, also beyond that limit.
Results
The result of a run is read from the end of its log:
| Result | Meaning |
|---|---|
| Succeeded | SnapRAID finished without errors. A diff that found changes, a dup that found duplicates and a fix or check whose errors were all recovered count as success too. |
| With warnings | SnapRAID finished but reported warnings (e.g. files changed during a sync), or a check found errors that a fix can repair |
| Failed | SnapRAID reported errors or stopped with a fatal error |
| Aborted | The run was stopped early, e.g. with Abort. SnapRAID saved its progress up to that point. |
| Incomplete | The log ends without a result, e.g. because the process was killed or the container stopped |
Retention and cleanup
Old logs are deleted according to two limits, set in config.json in the data directory (see Configuration):
| Setting | Default | Meaning |
|---|---|---|
logs.maxFiles |
100 |
Keep at most this many logs (the newest ones) |
logs.maxAge |
30 |
Delete logs older than this many days |
A log is deleted when it is beyond either limit. 0 turns a limit off.
The limits are applied when the backend starts and when you click Clean Old on the Logs page. Clean Old asks for confirmation and then reports how many logs were deleted, or that none were past their retention.
To delete a single log, use the trash icon next to it in the list (shown on hover) or Delete in the log view. The log of a running job can't be deleted.
[!TIP] The dashboard reads the last sync and scrub, the safety stop notice and the Check Report from the logs. If you delete those logs, the Last sync and Last scrub cards show No log, and the check report is no longer available until the next check.